

The introduction of VAR has been one of the biggest talking points in the 2019-20 Premier League season – but how big a difference has it made to the competition?
It’s important to note that this work does not seek to determine whether the VAR decisions have been correct or incorrect. It just shows how the league would look pre-VAR.
Some of the headline figures from the 2019-20 season have seen VAR chalk off 57 goals and award 10, disallow seven penalties but award a further 22, and overturn three red cards while awarding nine.
Thanks to the work of The Times, we’ve compiled the 2019-20 Premier League season if VAR had not been in use.
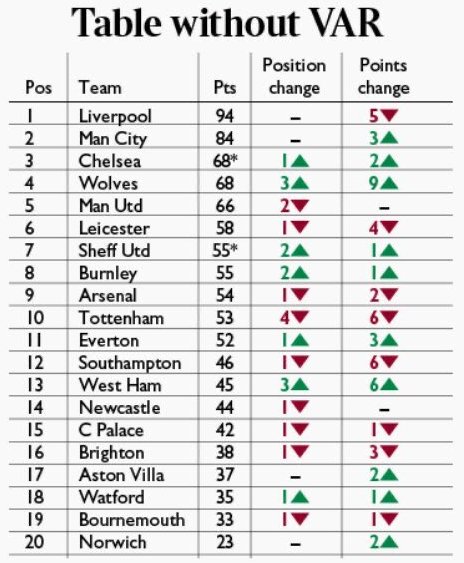

1. Liverpool – 94 points (five points fewer, same position)
2. Man City – 84 points (three points more, same position)
3. Chelsea – 68 points (two points more, one position higher)
4. Wolves – 68 points (nine points more, three positions higher)
5. Man Utd – 66 points (same points, two positions lower)
6. Leicester – 58 points (four points fewer, one position lower)
7. Sheff Utd – 55 points (one points more, two positions higher)
8. Burnley – 55 points (one points more, two positions higher)
9. Arsenal – 54 points (two points lower, one position lower)
10. Tottenham – 53 points (six points fewer, four positions lower)
11. Everton – 52 points (three points more, one position higher)
12. Southampton – 46 points (six points fewer, one position lower)
13. West Ham – 45 points (six points more, three position higher)
14. Newcastle – 44 points (same points, one position lower)
15. Crystal Palace – 42 points (one point fewer, one position lower)
16. Brighton – 38 points (three points fewer, one position lower)
17. Aston Villa – 37 points (two points more, same position)
18. Watford – 35 points (one point more, one position higher)
19. Bournemouth – 33 points (one point fewer, one place lower)
20. Norwich – 23 points (two points more, same position)